This afternoon, I decided to learn all I could about Charlestown High School.
Located 3,300 miles across the Atlantic at 240 Medford Street, Boston, Massachusetts, this public (state) school educates around 900 students from across the city.
I have never visited Charlestown High and probably never will, choosing the school at random as a test: how much could I find out from my laptop in a self-imposed time limit of just one hour?
Of course, schools are complex organisms. There is a limit to what one can learn in this way. I wanted to understand just how far this approach could take me.
Why a Massachusetts school?
The state of Massachusetts believes in collecting detailed educational data to focus its resources to maximise impact. The State also believes in making this data openly accessible.
Each year, students in 8 different years are tested and the State makes this data, together with insight into the students themselves, available to all - in anonymised form - so they can do their own analysis and form their own opinions.
Parents, teachers, policy wonks, educationalists, students, statisticians, Head Teachers and the AQi are all free to data roam.

Charlestown High School, Massachusetts
So what did I find out about Charlestown High School?
Located in a relatively deprived, urban area, Charlestown High faces challenges but the school is doing better than others with a similar profile. It had a good run in the middle of the decade but its performance has plateaued and in some areas the figures have slipped back in recent years. The school is receiving targeted State support.
The school’s students are mostly Hispanic (60%) or African-American (27%).
The students have high levels of need: 63% of students are from economically disadvantaged backgrounds (70% above the State average) and nearly half speak English as a second language, twice the average State level.
More data drills deeper into the needs of students, including levels of disability and basic English learning. All are relatively high at this school.
Do the students succeed?
The dropout rate at Charleston fell considerably during the last decade but has started to rise again in recent years, reaching 9%. Grade retention levels have also been gently rising.
The school struggles with English Language Arts performance with lower achievement levels. The levels have not improved but on the other hand the basic English learning levels have risen, so the educational task has got harder.
Charleston High also has lots to be positive about.
58% of Charleston High students have successfully graduated for the last 2 years. That level was only 42% in 2010. Maths and science achievement levels are significantly higher than similar schools and figures are rising.
The school is good at student growth. Students start with challenges but make significantly more progress than in many other schools, particularly in maths.
We could go into far more detail, picking away the layers, but I think you get the idea. There is 20 years of data in some areas and the committed observer with a penchant for excel could spend many happy hours with big spreadsheets.
I had just 60 minutes.
The Massachusetts Comprehensive Assessment System
What is the point of collecting all this data?
In the mid-1990s Massachusetts State undertook a series of reforms in a drive to improve the quality of public education, which was recognised as fragmented and sub-standard.
Clear curriculum frameworks were introduced, there were significant real terms increases in state funding and specialist Charter schools were commissioned.
But at the heart of the reform project was the MCAS – the Massachusetts Comprehensive Assessment System – an annual testing programme that covers 8 of the 12 years of school. Reaching the necessary level in these exams is essential for graduation.
The MCAS approach is interesting for several reasons:
-
Design: Developed over a 5 year period by leading educationalists, mathematicians and academics from top universities, the MCAS is respected and deeply embedded in the system.
-
Comparability over time: Testing structure and form have been preserved over the decades to allow long-term trend analysis.
-
Data granularity: There is considerable granularity, particularly about the background and progress of individual students, enabling detailed analysis and the identification of potential causations.
- Transparency: The data is available to all and analysed by a wide range of stakeholders including educational academics, policy makers, the State Department of Education, schools, teachers and parents. Nothing is hidden. The debate is open.
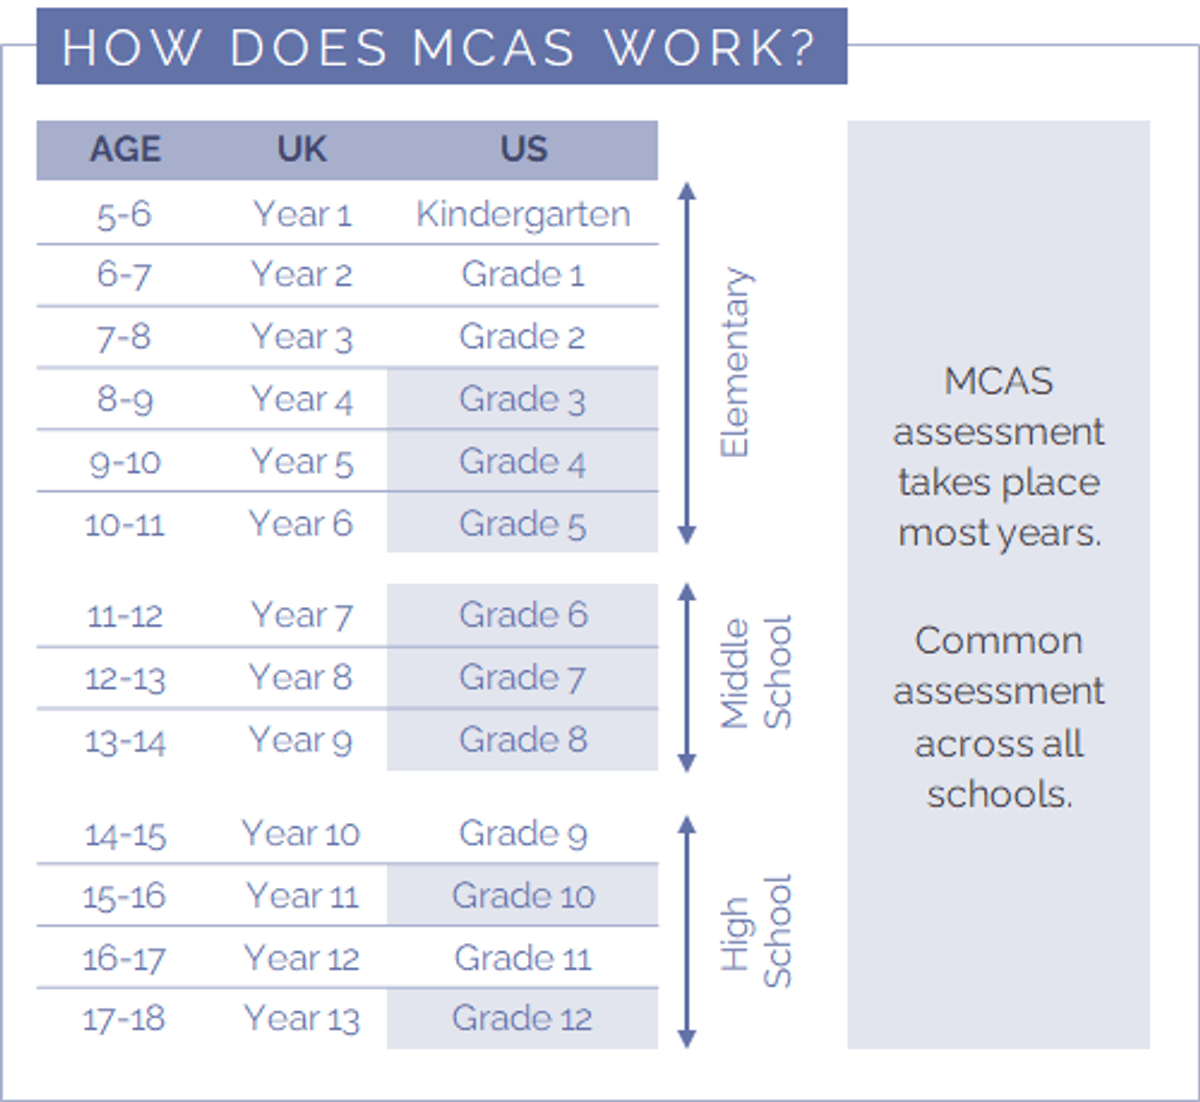
MCAS Assessment Timetable
Assessment, data and analysis are often seen as threatening concepts in the UK education system. They are an opportunity for government to hold schools to account on their performance and check that targets are met. The sword of Damocles of special measures hangs over those schools who do not perform against numerical benchmarks.
But this is not how the MCAS is perceived in Massachusetts.
Since the data is public, there are multiple analyses rather than the analytical keys being held by government.
Issues are identified and discussed by different organisations ranging from the Massachusetts Department of Education to Harvard and Boston universities and the schools themselves. Most schools use Edwin, a system specifically designed for schools to interpret the data, which helps them understand the data efficiently. Schools actively use the data as a tool to support the development of their strategies.
MCAS data is recognised as an important part of the school improvement programme, deeply embedded in the system after more than two decades. The benefits seem clear and the role of data is accepted.
In 2015, the PISA (the Programme for International Standards Assessment, run the OECD) study included analysis of 15-year-old students in Massachusetts as part of its global survey.
The results were impressive. In reading, maths and science, Massachusetts students significantly outperformed both the OECD average and the score for the United States. In both reading and science, Massachusetts scored at a level similar to the highest performing nations such as Singapore, Canada, Finland and Japan.
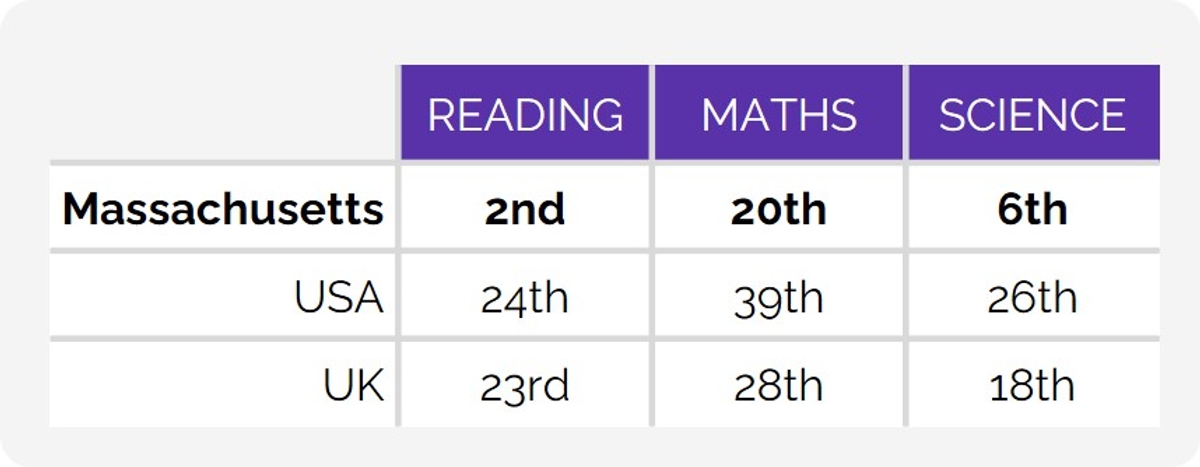
PISA Rankings: Massachusetts, the USA and the UK, 2015
Using data to guide school strategies
So what happens when a school’s MCAS results go bad?
The data is not used to impose special measures or to intervene aggressively.
The purpose of MCAS data is to define challenges and focus resources more effectively to address them.
Schools and districts that face challenges or poor or weakening performance can use the data to help understand the issues and are encouraged to bid for new investment to help address them.
That investment can come in many forms: adding new teachers, new training programmes, additional teaching resources or new facilities or buildings, for example.
Human support is also given to the management teams of under-performing schools.
The teams brought in to support the existing management teams tend to be former heads, teachers and academics. They take shared responsibility in finding solutions. The engagements can last 6-12 months, providing sustained, experienced support to the school.
The resulting strategies are often multi-year in duration. Progress is expected through improvements in MCAS results but it is recognised that this can take time.
What can we learn from Massachusetts?
Data can be your friend rather than your enemy. Well-thought-through data helps everybody to understand what is going on.
It is how the data is used that is crucial.
When data is made open and the approach to improvement and problem solving becomes collective, the long-term results can be very powerful indeed.
READ MORE INTERNATIONAL PERSPECTIVES:
Singapore: Global education pace setter looks for another gear
Estonia - a small country with big results
Massachusetts: The power of public education data
Finland: Going against the global trend